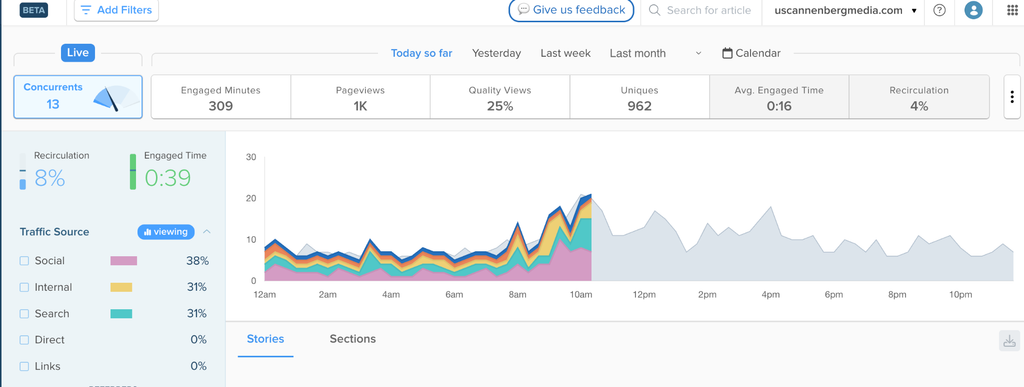
Using Chartbeat for Audience Metrics
This guide shows how to sign in to Chartbeat, launch the Heads Up Display on the site, and review audience engagement for the Annenberg Media website and published articles.
1. Open Chartbeat
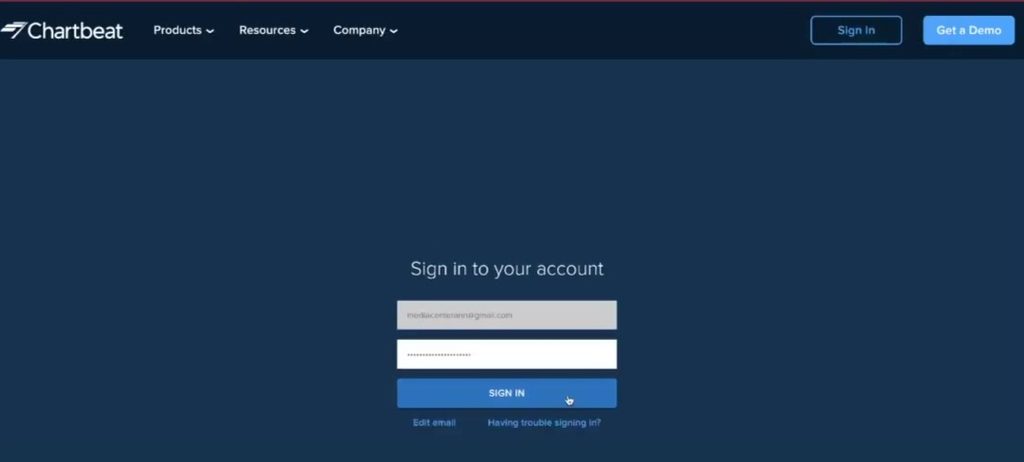
- Go to https://chartbeat.com/ and select Sign in.
- Login with the account credentials which can be found under Canvas in the #general channel of the Annenberg Media Slack
2. Open the Heads Up Display
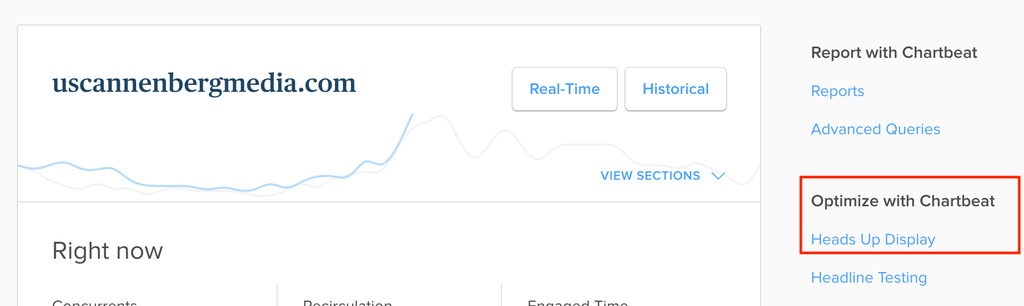
- Under Optimize with Chartbeat choose Heads Up Display and a window will appear
- Make sure uscannenbergmedia.com is chosen under Select Site and click Activate Heads Up Display.
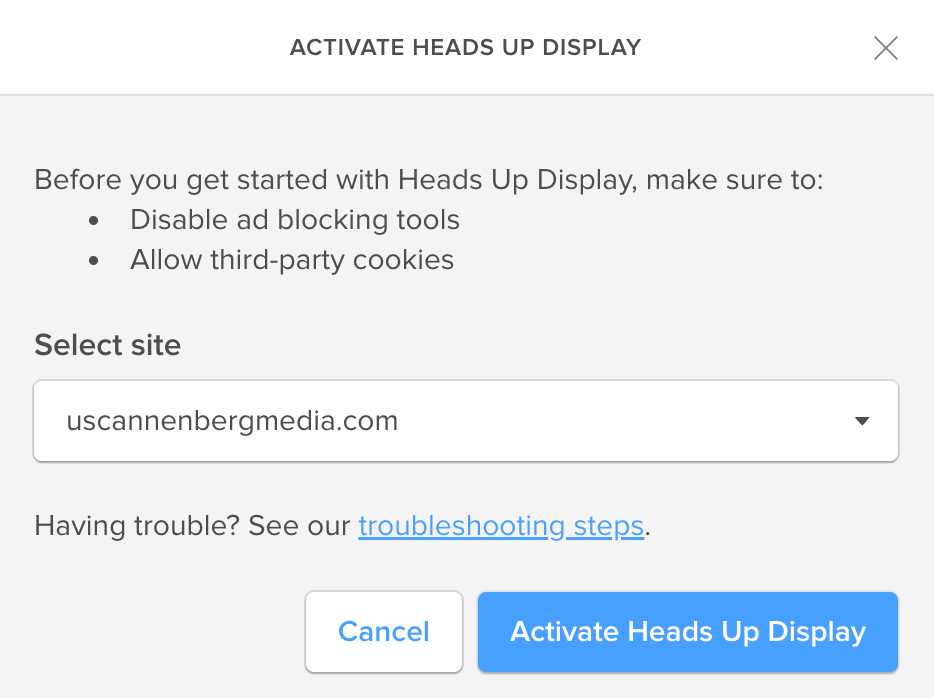
- Select Take me there to open the live site of Annenberg Media. You should see the HUD as a floating tile on the Annenberg website. If you don’t see the HUD, make sure to disable any Ad blockers.
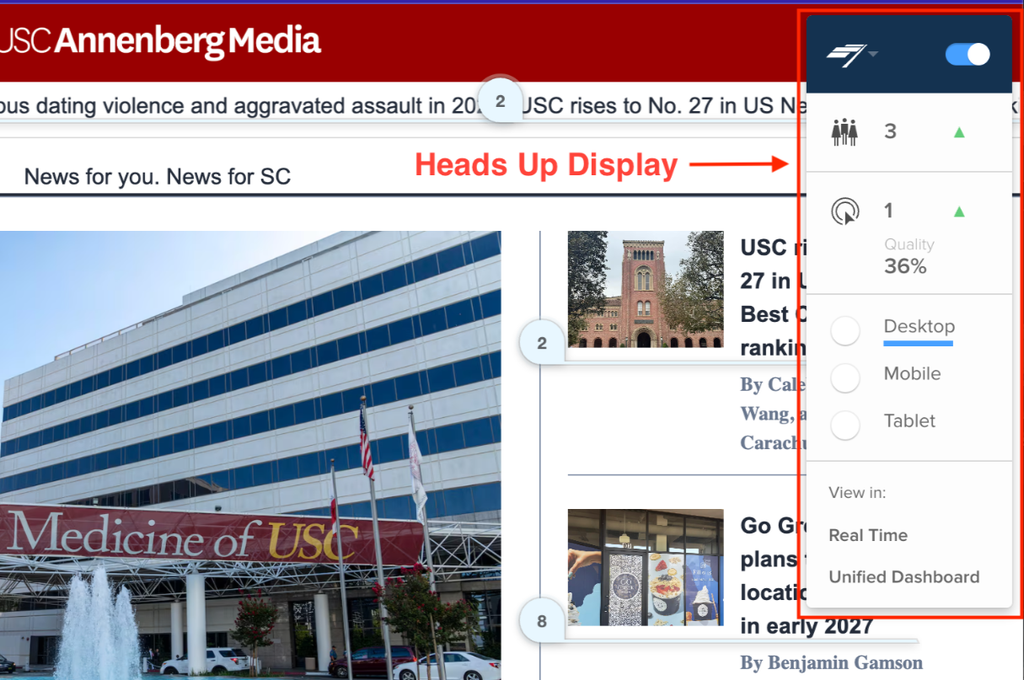
- Treat the live display as a current snapshot; it will change as readers enter, leave, scroll, and click.
3. Analytics for articles and website
- Navigate to the story you want to evaluate.
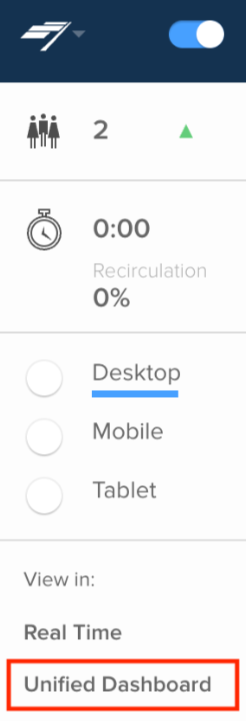
- Select Unified Dashboard in the HUD panel to see the traffic analytics for the article.
- You will see analytics for various types of engagement for the article and can customize the time-range.
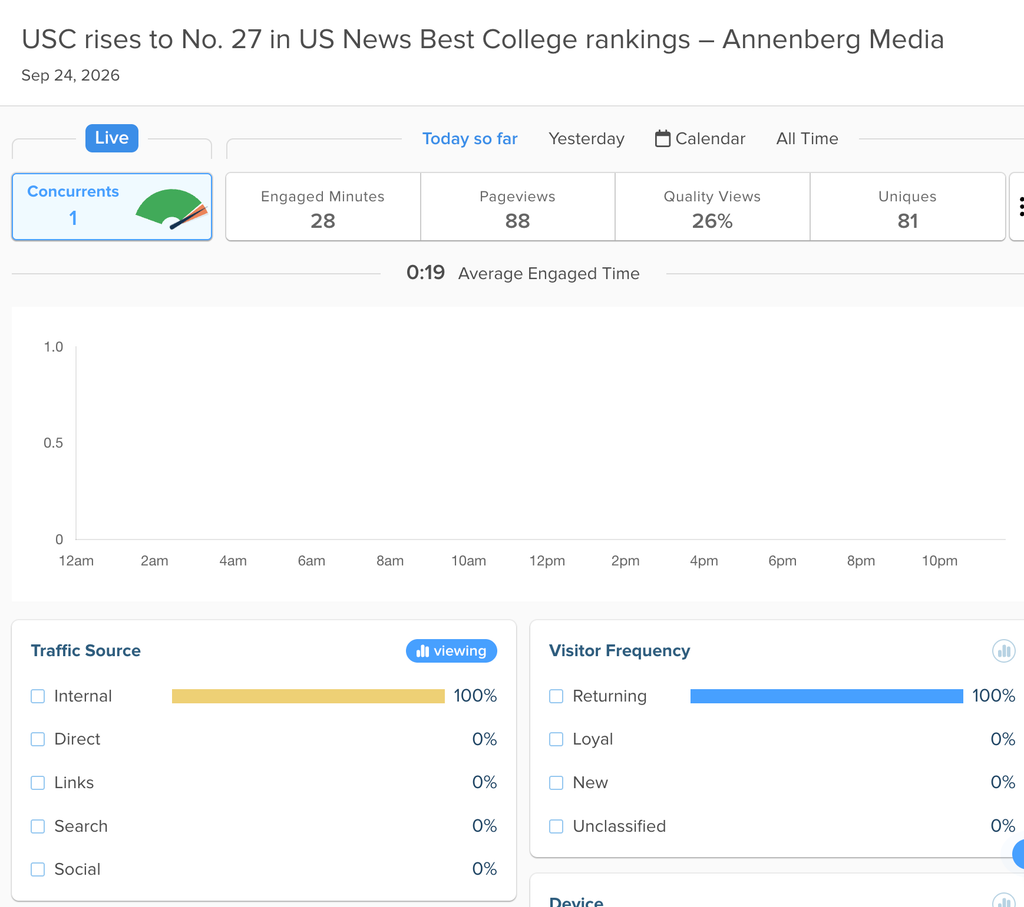
- If you want to view the site analytics, click out of the unified display for the article.